how to make models run faster
As part of my work at Meta I was given the (sorta) vague task of "improve this language identification model please." At first I was pretty overwhelmed since I had never touched a production model let alone a model that was queried as much as this one across the company but (as any over-ambitious new grad) I was determined to make it happen. Long story short I was able to fix some pretty serious problems regarding english recall with the model which basically meant that obviously english text wasn't being classified as some other language anymore which was really good!
However there was another issue and one that I think is probably equally as important as fixing critical model quality issues. How do we actually transfer these quality improvements to production? As is normal at Meta we were deploying on a new internal framework so we were completely unaware of any potential challenges that we could face. We sort of thought that since our improved model had roughly the same number of parameters and architecture as our previous model we would automatically have the same throughput in production. We were wrong about that (lol). We had roughly 2.5x less throughput than our previous deployment which meant that we couldn't deploy our improvements at all!
If you don't know what throughput means, what determines it and why it's super-duper important to benchmarking performance, here's a quick explanation:
Imagine you're waiting in some line for pizza. Now what would you expect that the time it takes to go from entering the store to actually getting the slice of pepperoni pizza (the best kind of pizza) would depend on? Hmmm… you'd probably guess it depends on the number of people in line, the number of cashiers taking orders, how long each order takes, the number of chefs the number of ovens, and then generally how fast each of the steps take.
We can define throughput (in this context) as the number of people that the pizza shop can serve over a given interval of time. We can also define E2E (end to end) latency as the time it takes for you to enter the shop to actually getting the pizza. Here's a neat diagram generated by NanoBanana pro which probably does a better job of describing the concept than I just did:
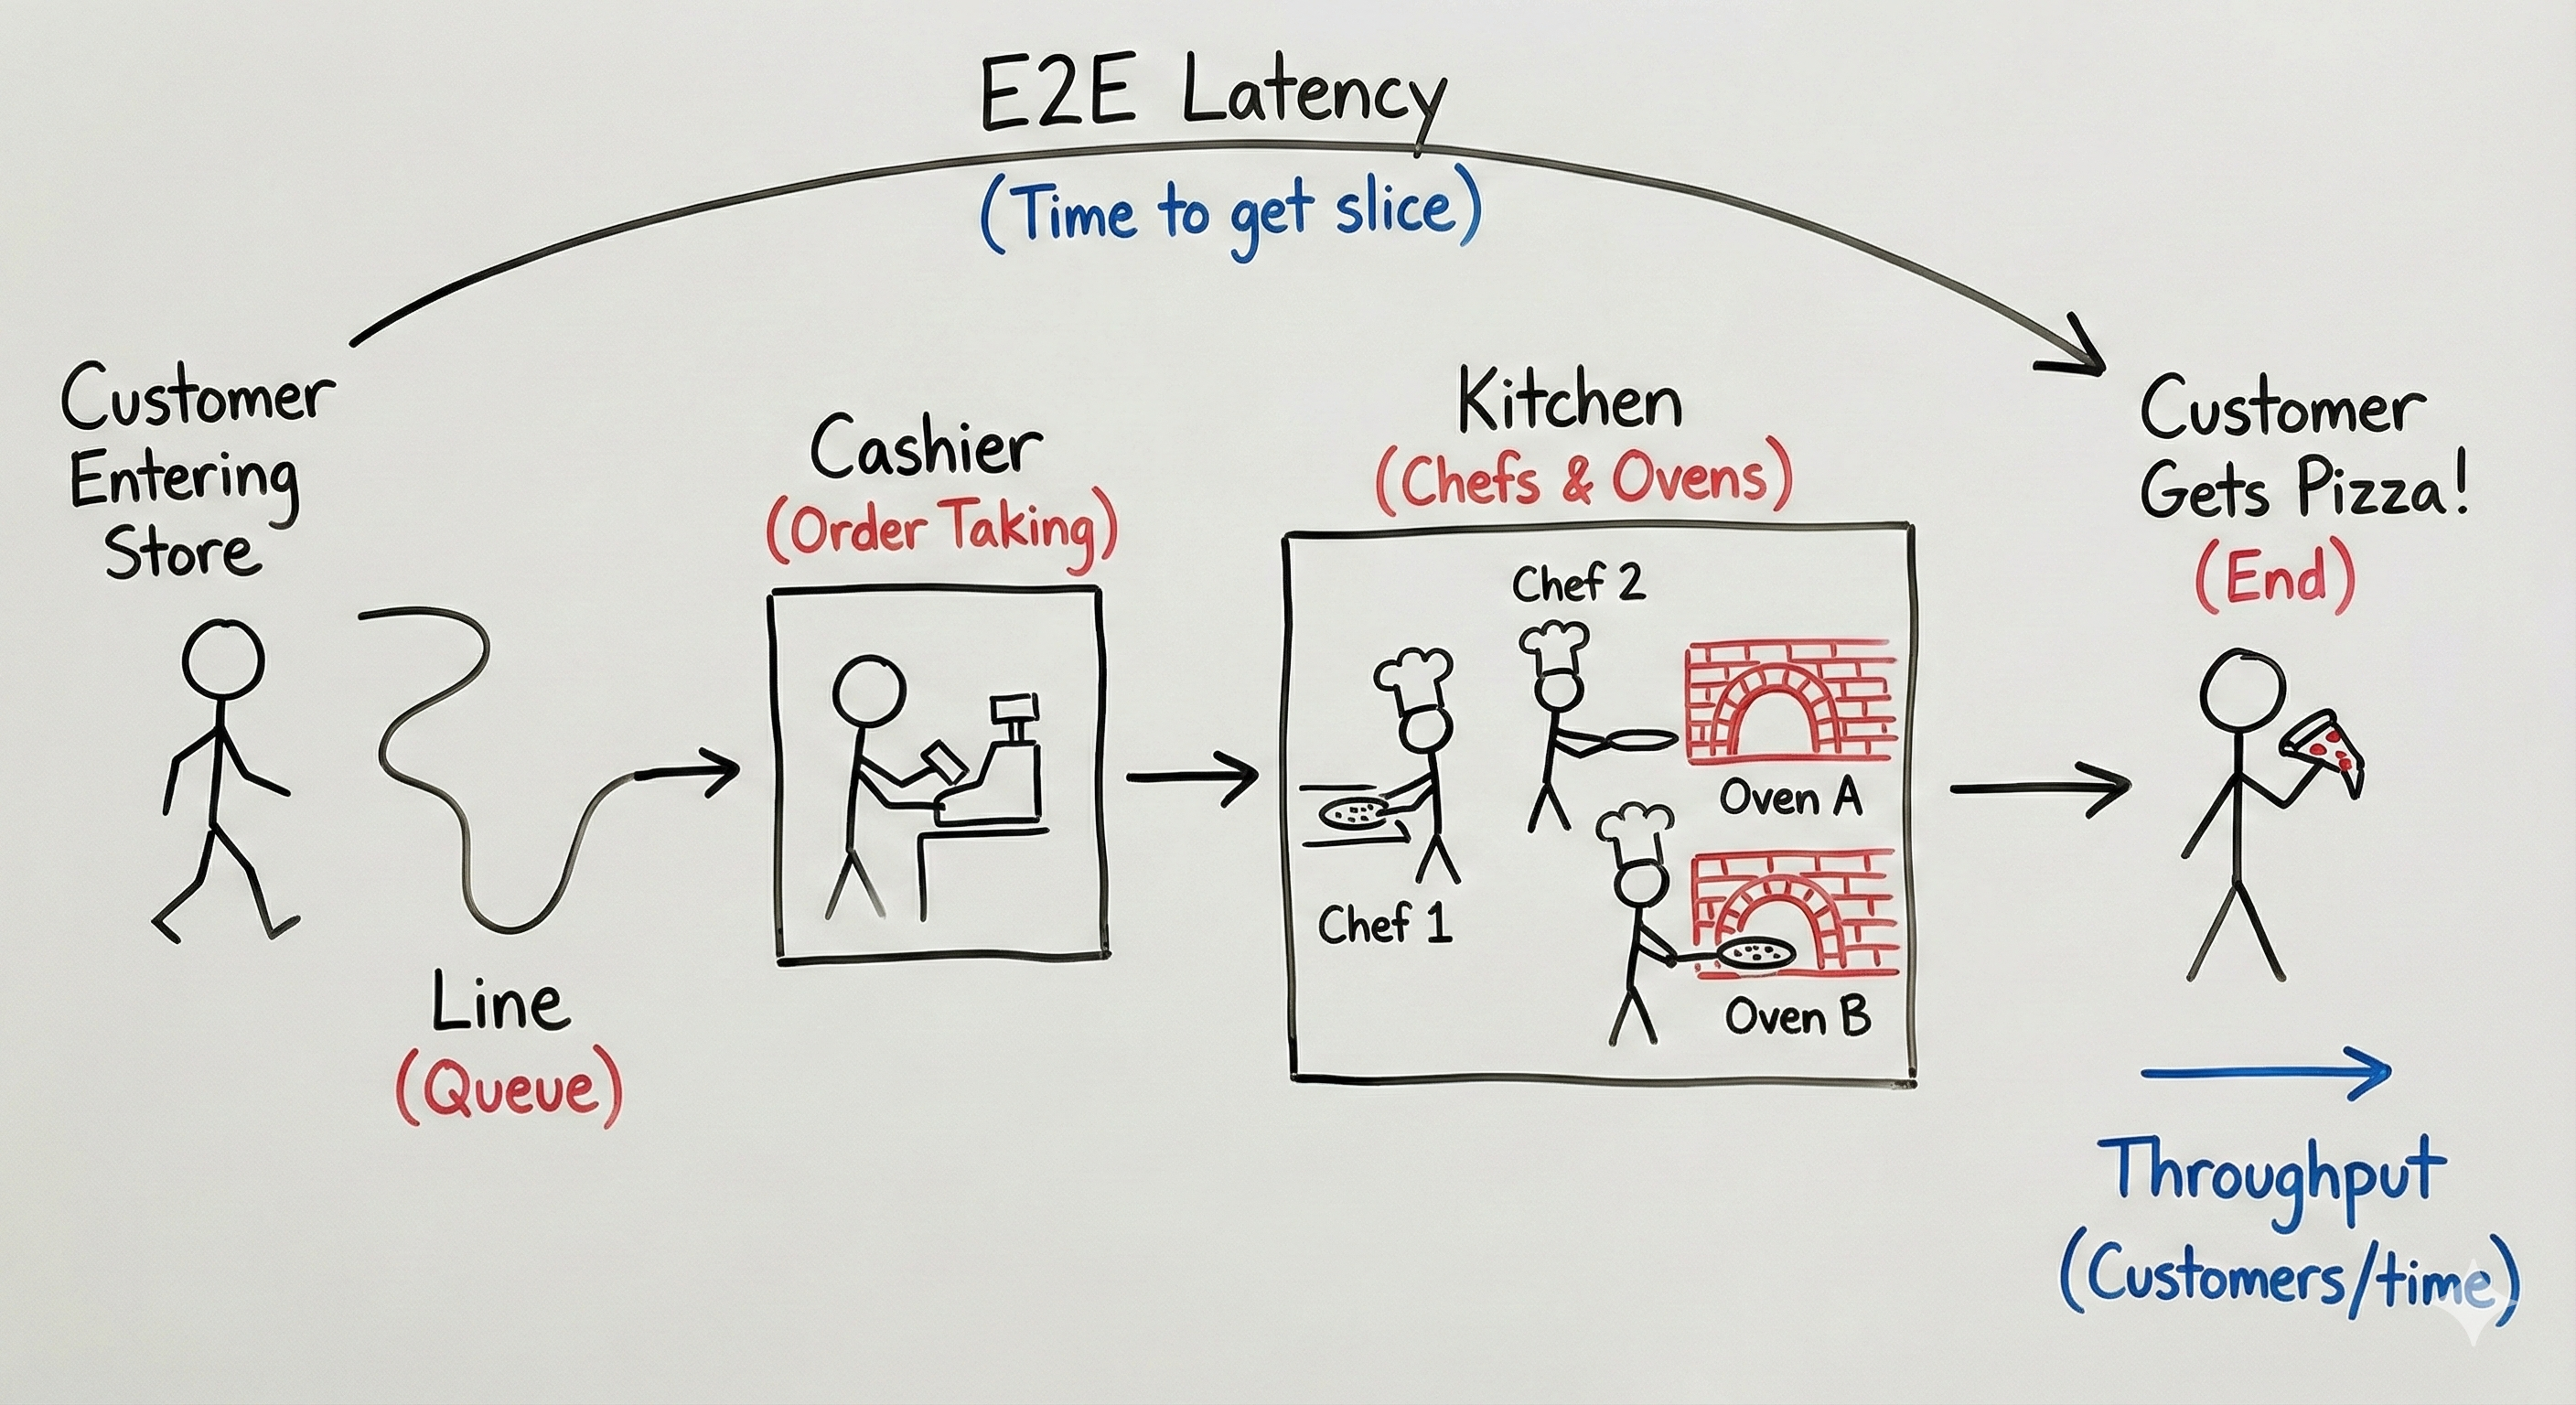
So to translate, instead of a pizza shop we're dealing with production-grade machine learning systems using thousands of really expensive GPUs (aka the chefs) and trillions of requests (pizza orders aka HTTP request) and seeing how many requests we can process successfully over a period of around a second a.k.a QPS (queries per second).
Cool, back to the story. So now we're panicking because we can't actually deploy our model since we're regressing compared to our old model deployment. This is pretty bad since a lot of our clients don't have extra compute lying around to spend on a more "expensive" new model and thus we can't actually launch our improvements!
This is where I was tasked with trying to improve the QPS of our model back to where it was previously…. Let's do some model optimization to save the day:
Technique #1: Profiling!
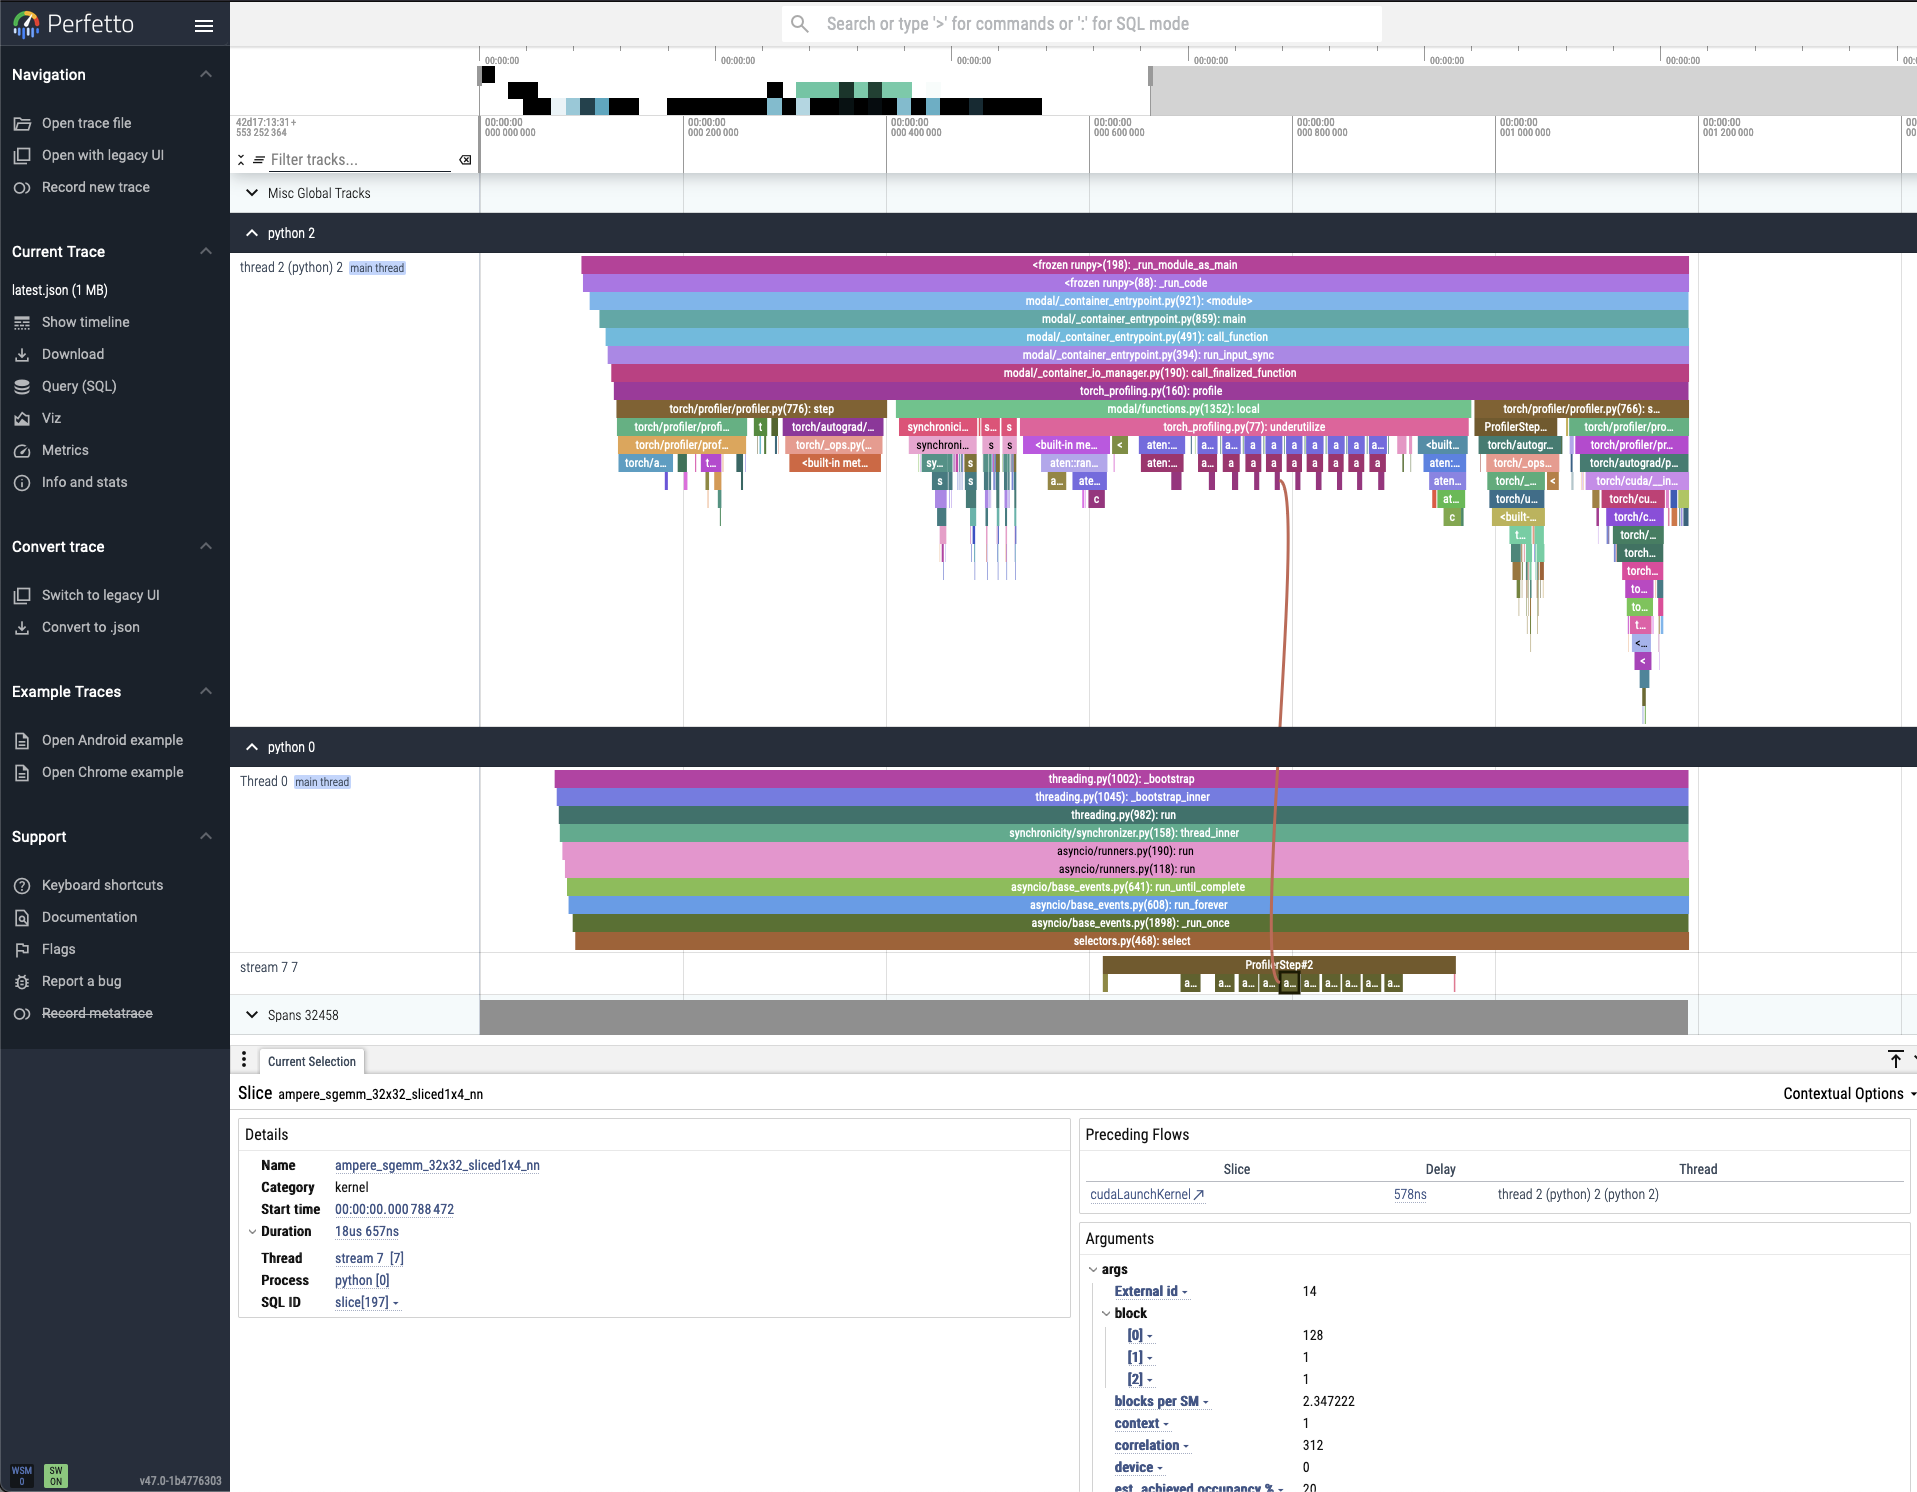
How can we optimize something that we can't even see? It would be really nice to track where a single request goes in order to understand the different transformations it undergoes until it comes out the other end of our system as a language prediction! This is where profiling our CPU and GPU is really useful. The profiler is something that you run as you're running a QPS (load) test on a local GPU so you can see the actual activity that's happening. Understanding how to use the profiler is super important to improving your model. Here's an example of a what a profiler looks like:
What profiling is most useful for is understanding what is bottlenecking your system which can be used to generate hypotheses about what can improve your system's QPS the most. Thus, we can reduce model optimization efforts down to this (super generalized) iterative loop:
- Profile model on standalone GPU during QPS load test
- Read profiler output to identify bottlenecks
- Optimize model deployment implementation
- Reprofile model and measure QPS
- If QPS increases that's good!! and if not… try again :)
If you want more details on GPU profiling I suggest you read this PyTorch documentation as it goes in depth and is written by people that are better than me at this stuff :)
Technique #2: torch.compile
One powerful model optimization technique is the idea of "compiling" your model. When I first heard of this I had only heard "compilation" in the context of programming languages. My memories flashed-back to how compilers do things like pruning syntax trees, unrolling loops and removing unnecessary branching so that the code we write is optimized to run on the machine we're using. In essence, torch.compile is trying to do the same thing except that the "code" is a PyTorch model defined by individual and nested modules and the machines we're running on are (usually) GPUs. This results in a model that has equivalent output but runs much faster.
Now how exactly does this happen and how do we do this? From a client's perspective it's easy! You just define some PyTorch model and then call:
compiled_model = torch.compile(model)Usually this works for most models since the actual operations which define most machine learning models are shared across various types of models. torch.compile is really good at spotting and taking advantage of these redundancies and (generally) replaces multiple instructions with kernels that are written to optimize the execution of those instructions on specific machines. How exactly to identify certain redundancies across models and write these optimized kernels is a (very difficult) problem that very talented people try to solve! More about how model compilation works is here.
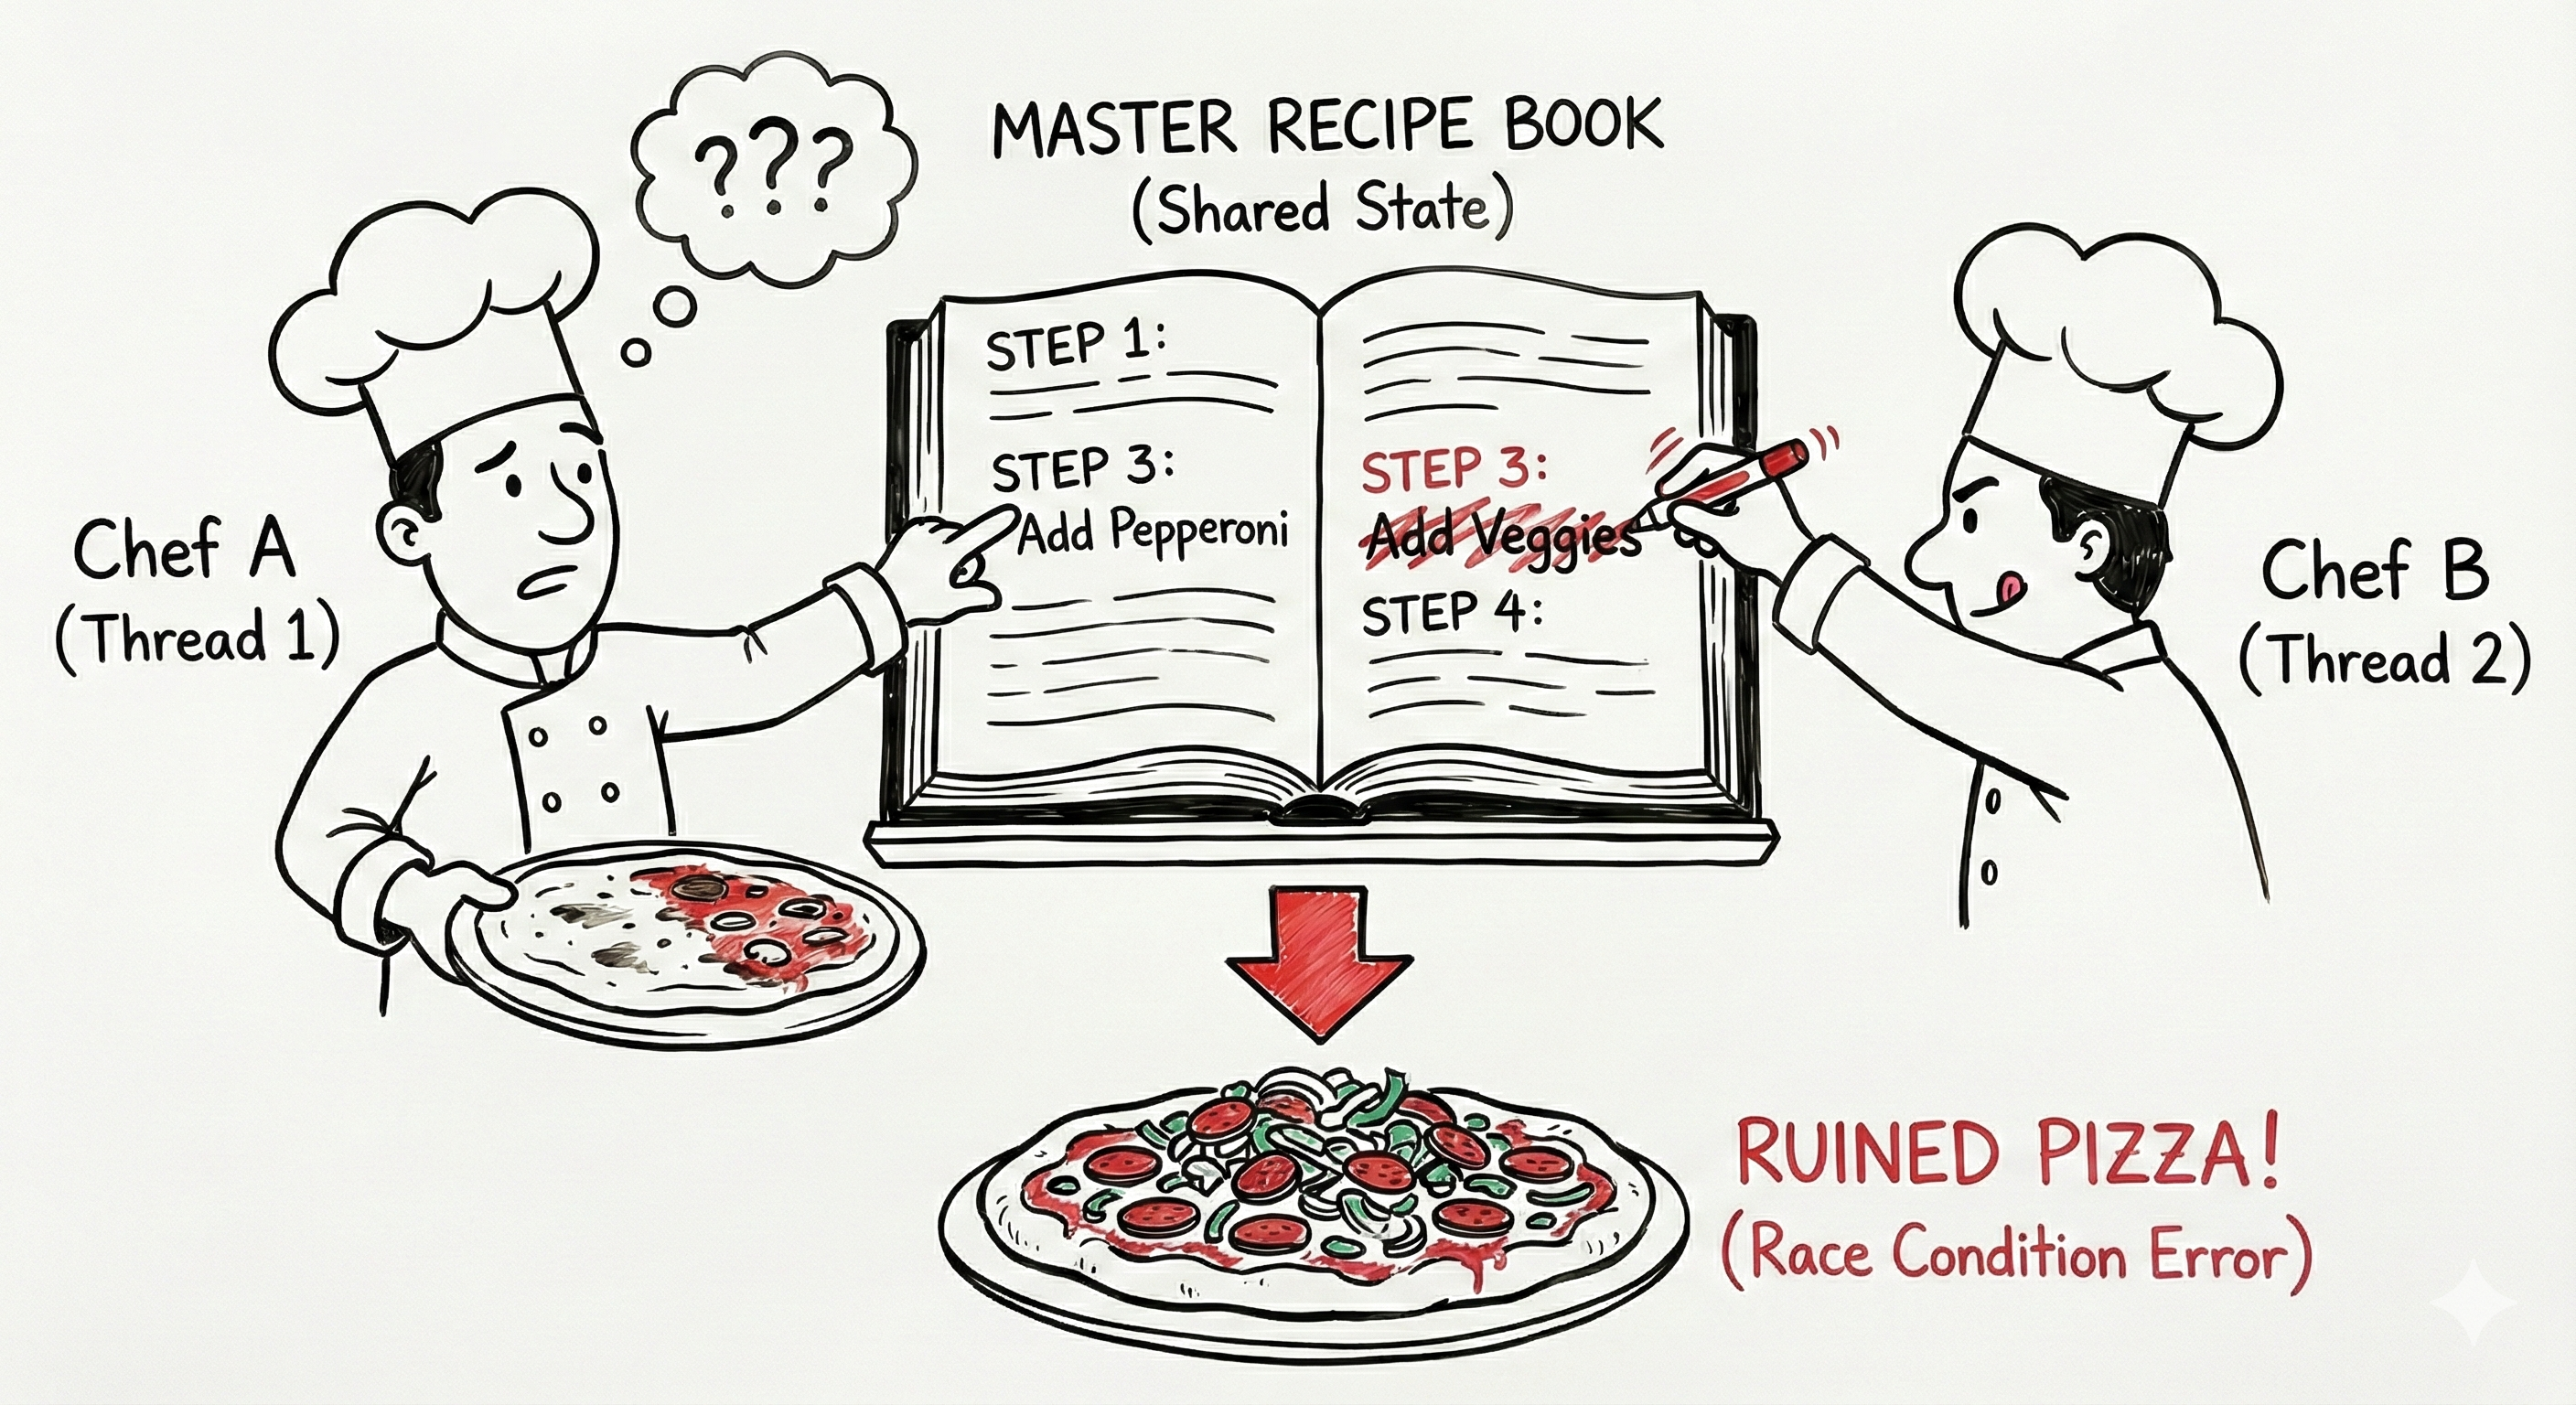
One quirk about using torch.compile is that it is NOT thread-safe. Why is this an issue? Going back to the pizza analogy now:
Imagine the Head Chef (the compiler) invents a brand new, super-fast way to make pizza and writes it in a master recipe book. Now, two chefs receiving different orders (pepperoni and vegetarian pizza) try to both optimize the recipe for their different orders. As one chef scribbles a change for a new order, the other chef unknowingly follows the halfway-written instruction and ruins their pizza.
The issue lies in the fact that the input to the model affects how we run our model compilation during torch.compile. For our purposes, we define the shape of our input as the num_requests x max([seq_len_1, seq_len_2, ...]). The shape of our input matters because different input sizes determine cache locality and tiling patterns on the GPU which are important for fast lookups and caching behavior.
Ideally, we try to "warm up" the model by presenting it with input shapes that we would actually see in production so that we can cache different compiled versions of our model for the input shape the model sees during production. More on this here.
In some cases, torch.compile can't build a compiled version of your model for some set of input shapes (usually for one of these reasons). This is bad because it means that some portion of your model's graph cannot be optimized which leads to slowdowns. You know that your compiled model has graph breaks when you see a more than one of "torch compiled regions" in your profiler.
We had this exact problem with our custom-defined modules which means that we had to copy our weights to a known HuggingFace architecture which torch.compile worked on. Doing this led to a 2x improvement in QPS!
Technique #3: Multiple request streams
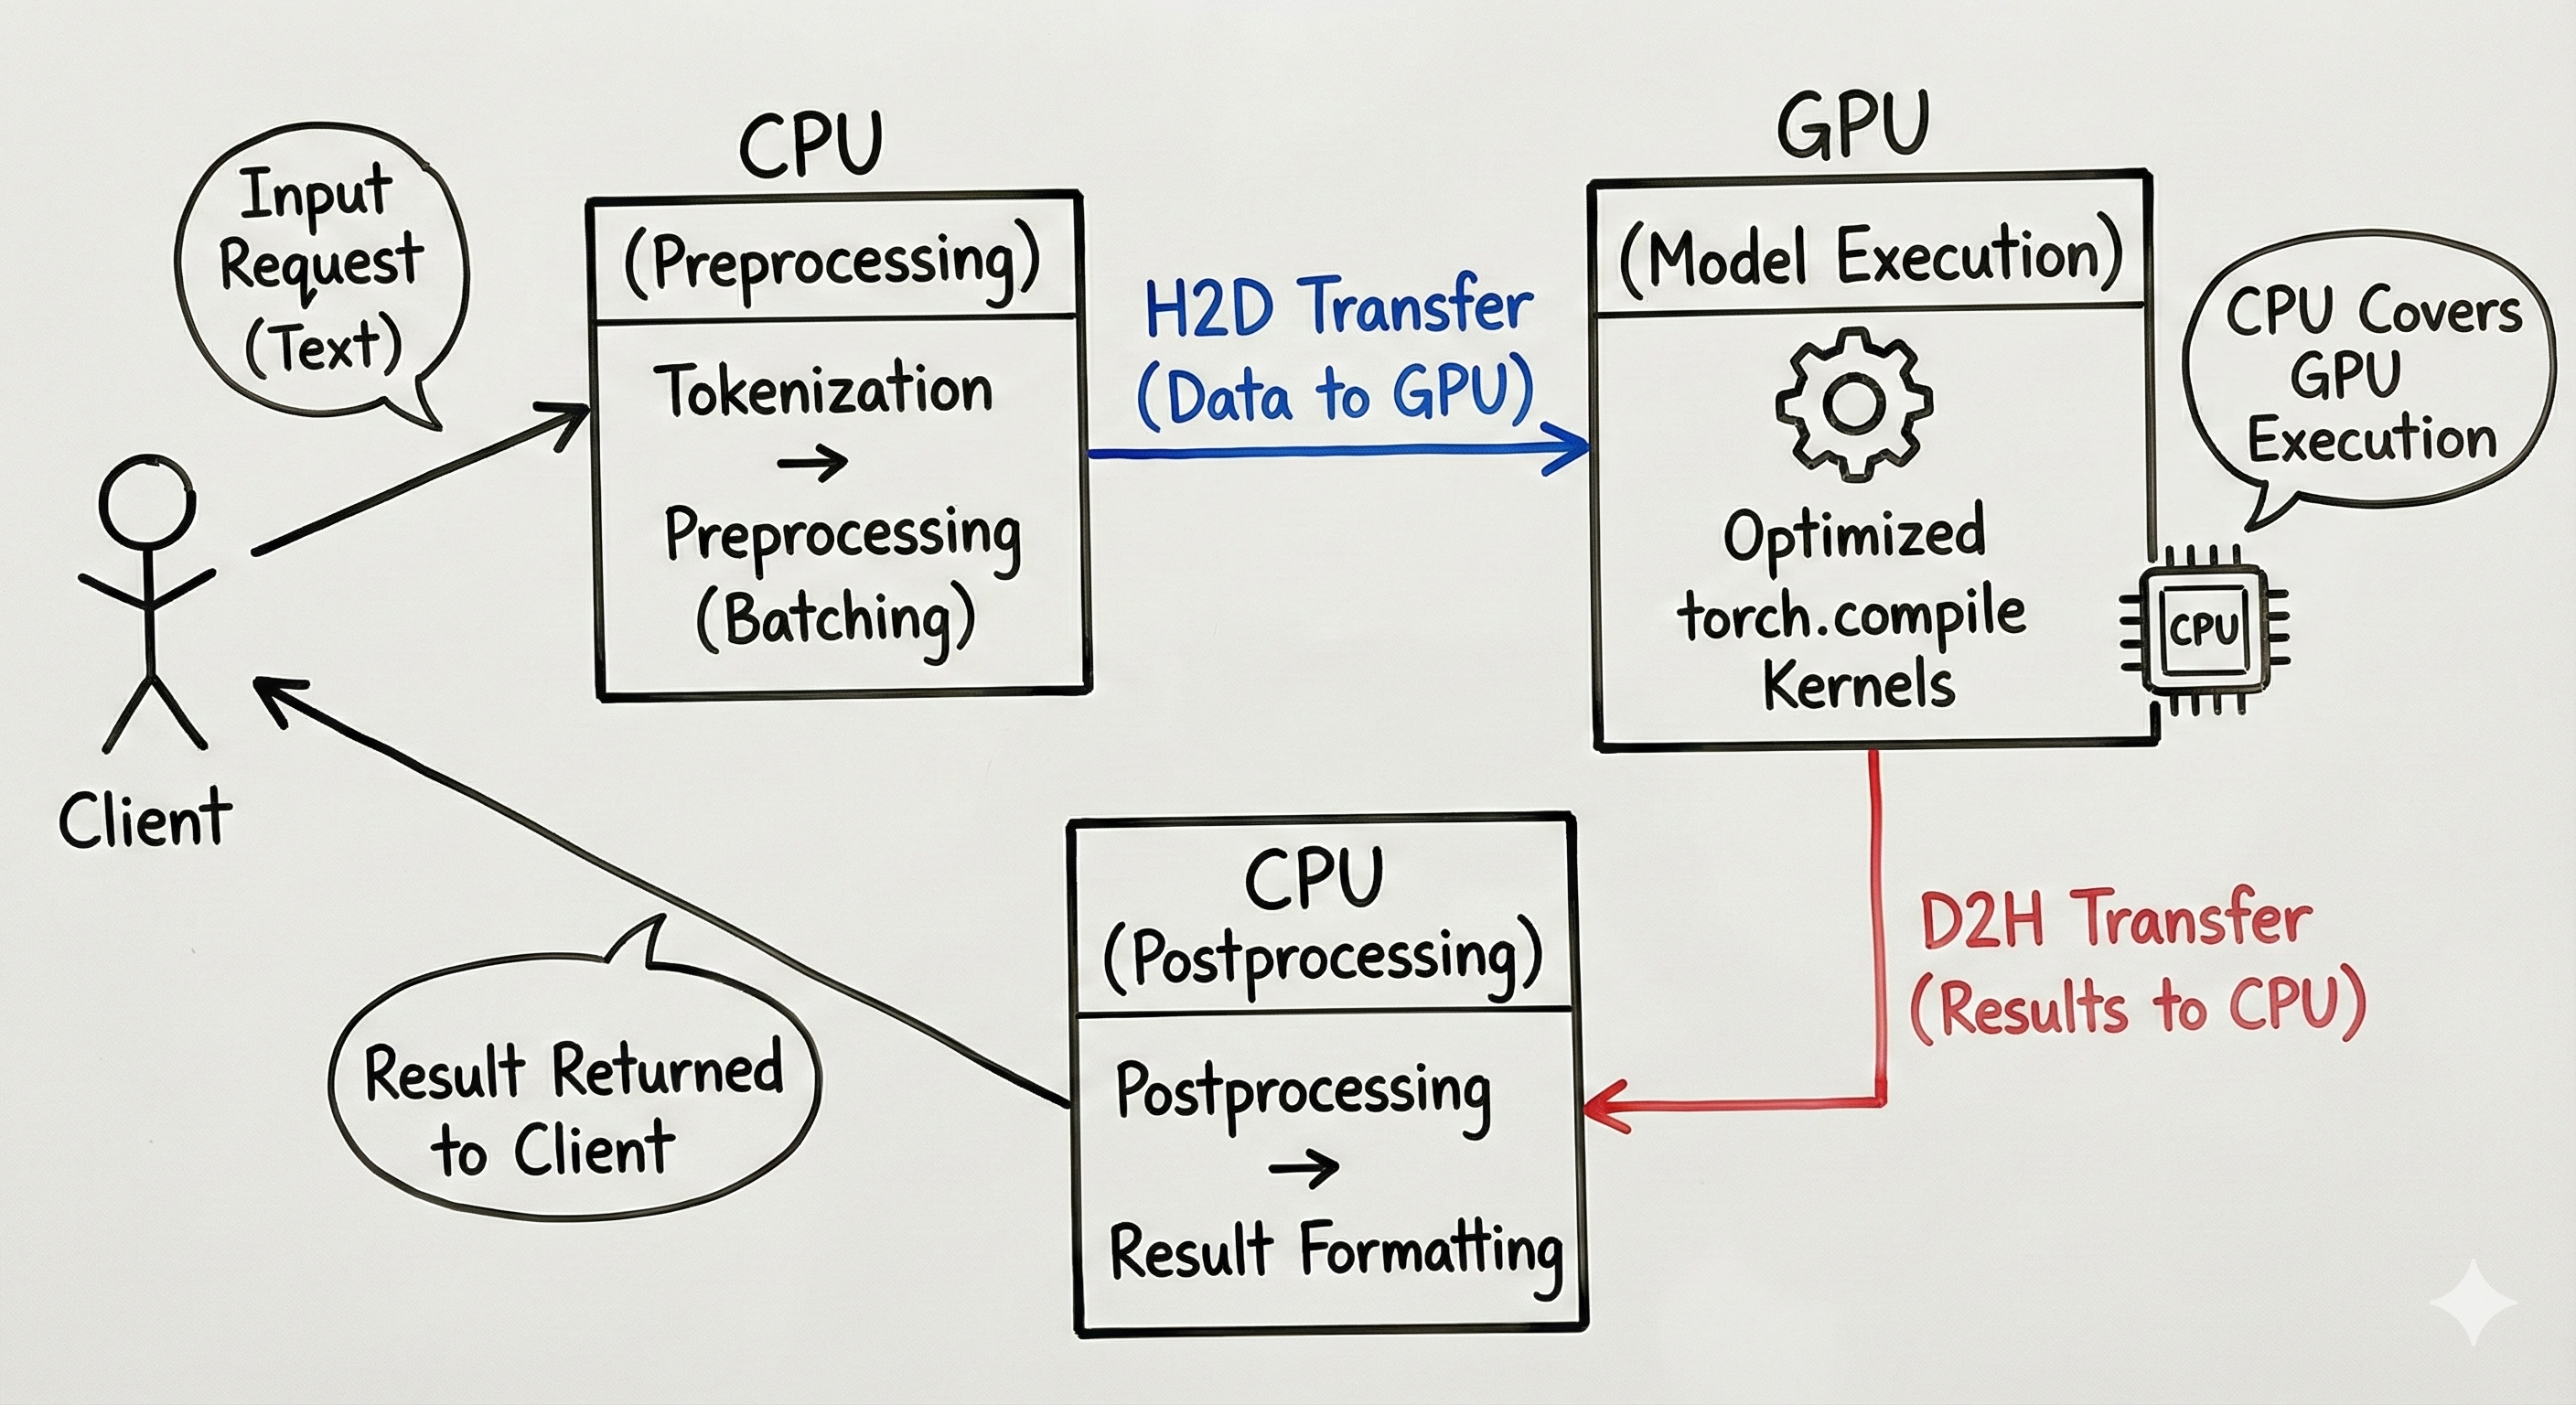
The general flow of our model was this: input request, tokenization, preprocessing into batches on the CPU, H2D transfer to GPU, CPU covers the GPU while GPU executes optimized torch.compile kernels, D2H transfer back to CPU, CPU postprocessing and result returned to client.
Generally by optimizing any of these steps you improve the QPS. However what if there was a way to not improve the latency of any of these steps but improve the QPS? Sounds impossible right?
Luckily for us machines nowadays have a lot of CPUs. We can take advantage of this by running multiple preprocessing and postprocessing threads at once! This is important because now the GPU isn't waiting for a single thread to finish preprocessing before it receives input for inference. By specifying multiple threads for preprocessing and postprocessing and locking the model during inference (mutex) we avoid issues with multi-threaded torch.compiled model inference (explained above).
My teammate incorrectly thought that parallelizing the preprocessing step would lead to unsafe behavior when using our compiled model. After correcting the misunderstanding and parallelizing the preprocessing steps we saw a QPS improvement of 1.5x!
Technique #4: Nested Jagged Tensors
Usually, in production grade systems we pad our input tensors to some predefined max_seq_len which makes executing torch.compile easier since shapes are deterministic. However, depending on your model you could think of using something called NJTs (Nested Jagged Tensors). These are especially useful when most of your incoming requests are skewed towards shorter sequences (as was in our case) as most of your token_ids end up becoming pad_token_id. This is common across a wide variety of domains like recommendation systems that take user history as input, chatbots and speech recognition to name a few.
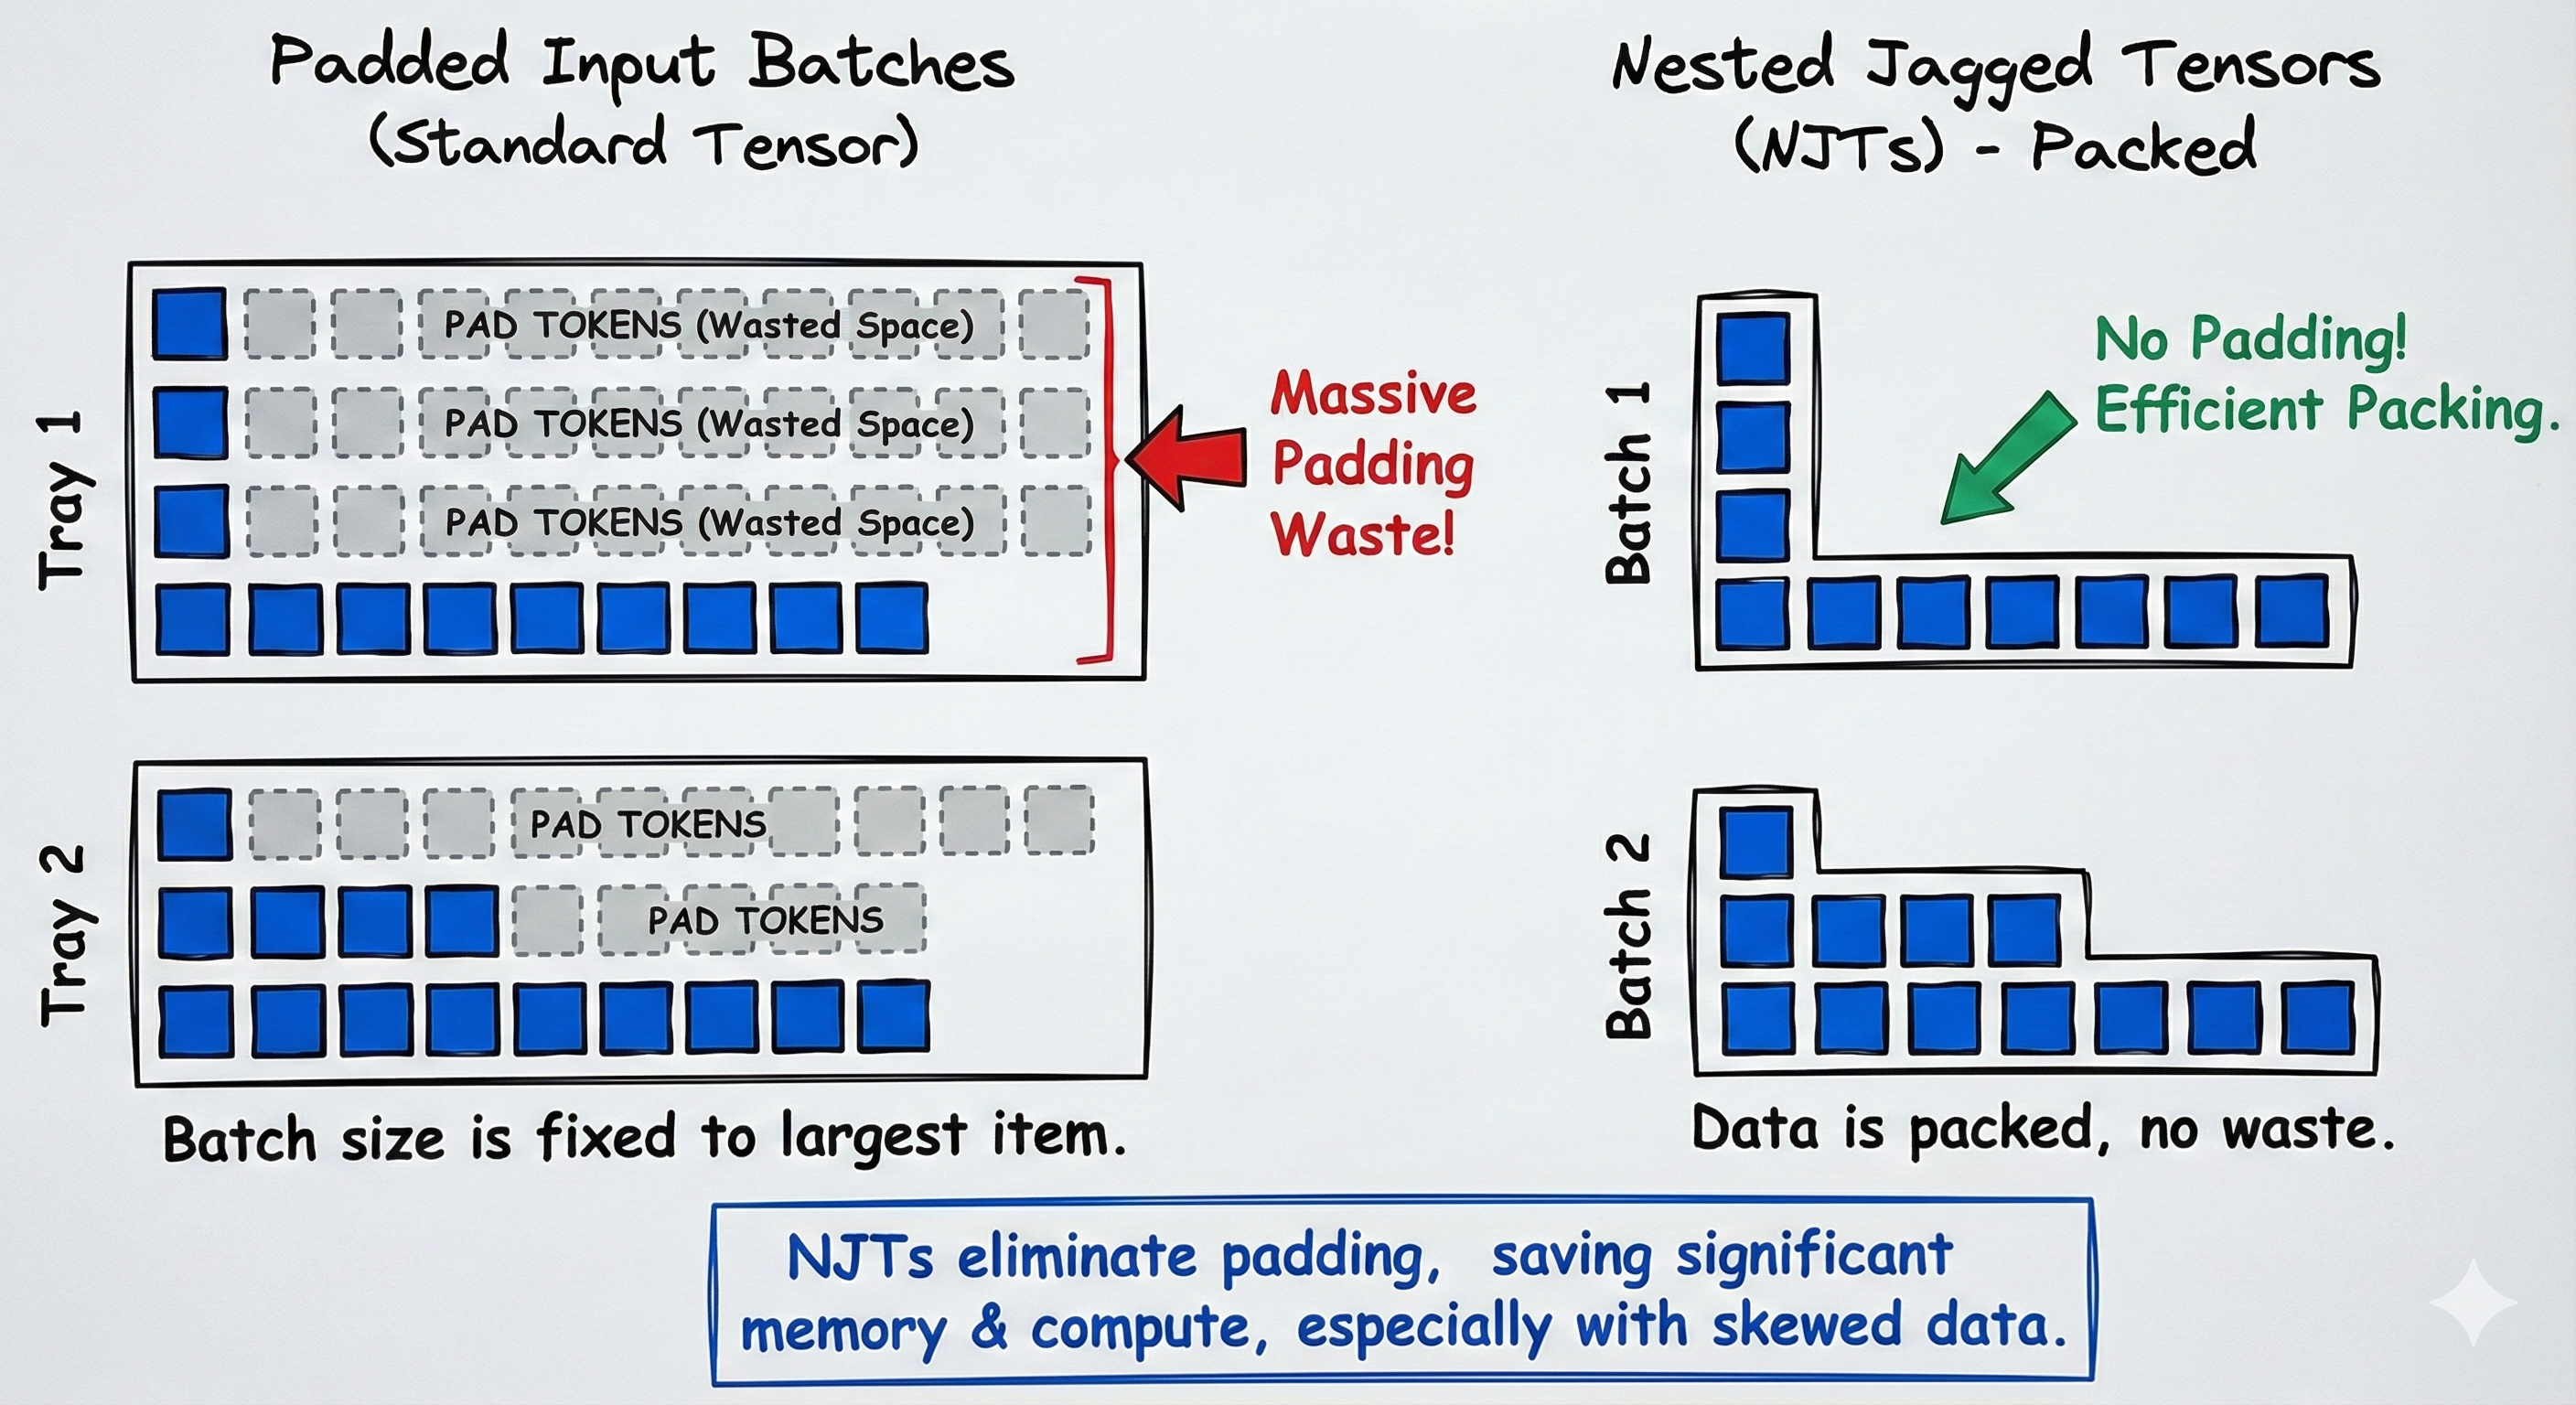
NJTs don't come for free though. Our first attempts at making our model compatible with NJTs resulted in many graph breaks. After some debugging and collaboration with the PyTorch Compiler team we discovered even some operations (like attention) don't fully support NJTs on certain types of hardware (yet). This led us to converting NJTs to padded tensors before certain operations which slows us down but actually saves us from graph breaks.
The end result was a model that ran inference ~4x faster and in production led to 2.2x QPS over our initial baseline! We also achieved parity with our existing deployment which meant we were free to launch our model improvements! Yay!
Takeaways
Model optimization is extremely fun because it can be compressed into a game that you play against the model and its varying input shapes. More generally, you're trying to answer the question: "How far can I push QPS using my understanding of the underlying hardware and the different interfaces made available to me through PyTorch, Python and CUDA?". Seeing immediate performance gains after testing a hypothesis is a feeling of excitement that feels like you're solving a sudoku puzzle. It's a fun game to play and I highly recommend you try optimizing your models!
I think it is important to note that this field goes a lot deeper than the aforementioned techniques and I didn't even touch on topics like quantization, pruning, distillation, etc.
My hope is that this blog perhaps taught you a little bit more about how you can speed up your models and make them more efficient so that you can deploy artificial intelligence into the world :)